Generating Graphics
In MainForm( dashboard ) were added some examples of dynamic chart generation.
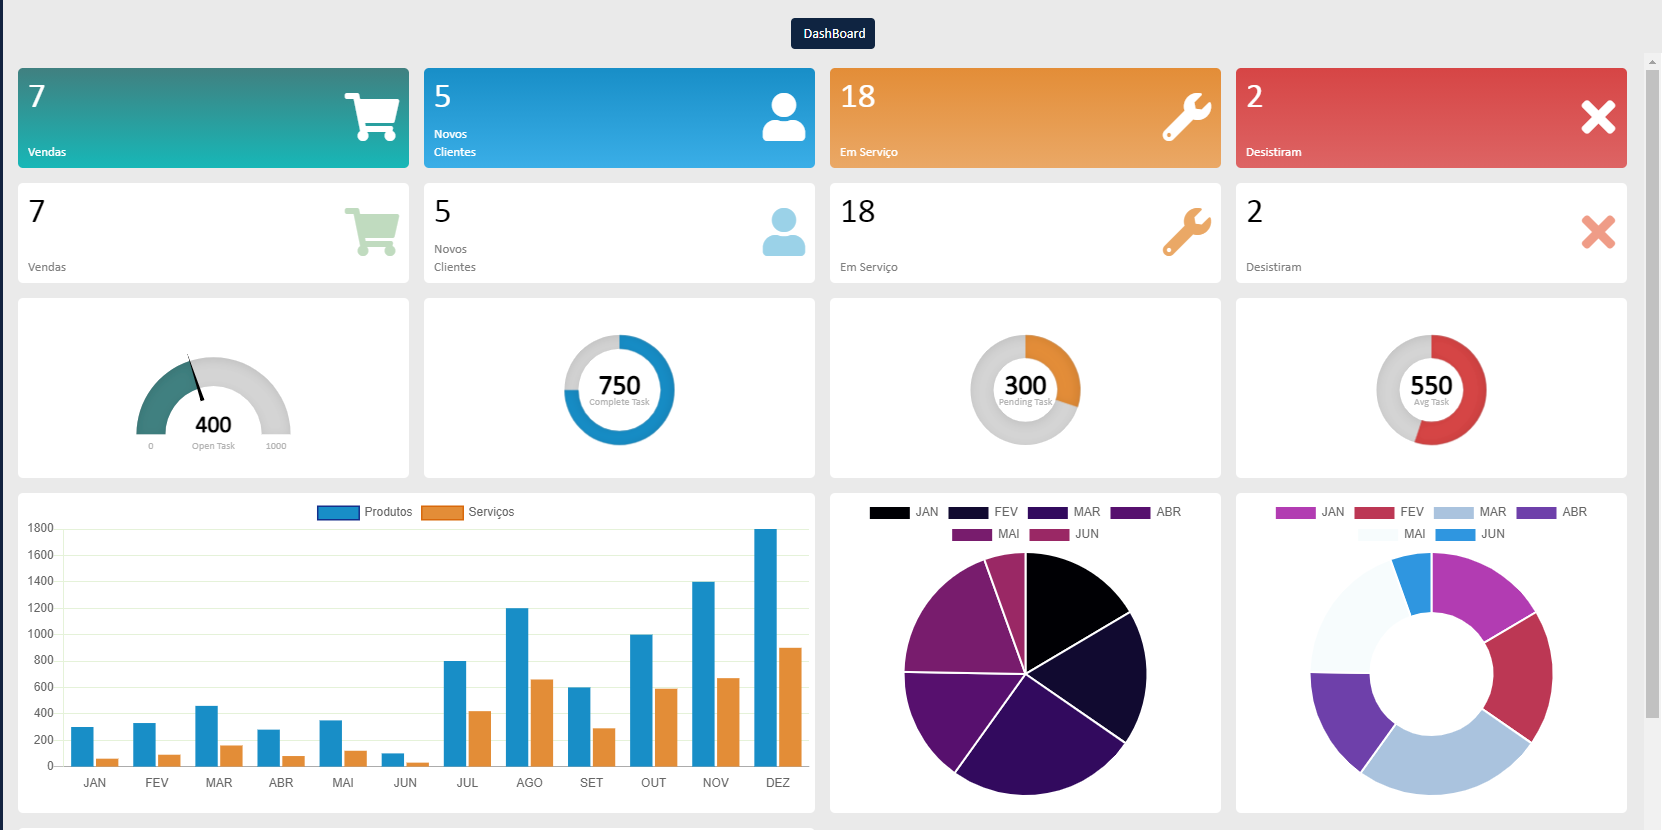
The intention is simply to facilitate use, but creating graphics is something very particular as it depends on several factors in the application and each model has different settings.
In practice, study the HTML format which is nothing more than Strings and you will be able to create loops in your queries to format / fill / create your graphics.
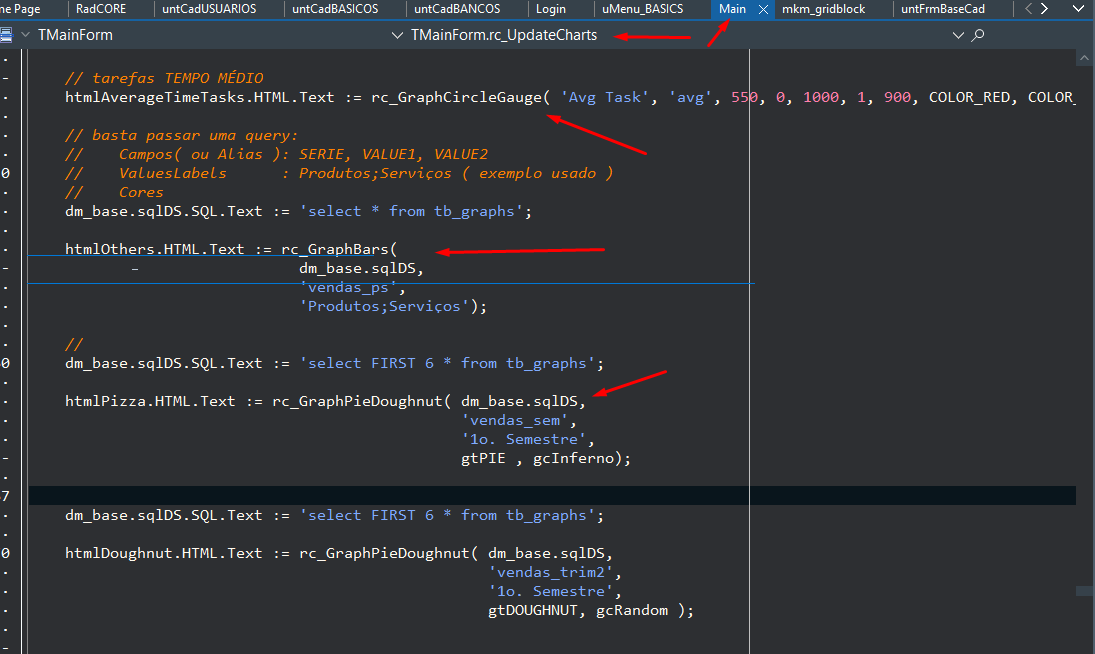
Be aware of the "pID" parameter. Each chart has to have its own.
See the rc_UpdateCharts procedure and study the examples:
The table "tb_graphs" was created as an example.
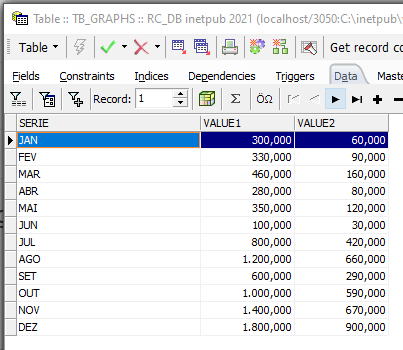
You can generate a SELECT on any table in your database to pass as a parameter, only, your select must have as return the fields "SERIE, VALUE1 and VALUE2" to be read by the function.
You can do this using ALIAS in your SELECT.
Ex:
SELECT FIELDMONTHS as SERIE, SUBTOTAL as VALUE1, TOTAL as VALUE2 ....
Created with the Personal Edition of HelpNDoc: News and information about help authoring tools and software